What is loudness, and why does it matter in the long run?
Loudness is one of those terms that often gets used and misused by those starting in the audio industry, but understanding what loudness is will make sure that your audio stands out in today’s streaming world.
Loudness
Loudness is a subjective term, which corresponds closely to sound intensity but is not the same as sound intensity. It can be defined as “the attribute of a sound that determines the magnitude of the auditory sensation produced and that primarily depends on the amplitude of the sound wave involved.” (Merriam-Webster). The crucial factor to remember about loudness is that it is ‘subjective’. Like many things in life, and especially in audio, subjectivity can lead to problems. What we need is precision.
Whilst there are some parallels with sound intensity, we should always remember the subjective nature of perception when using the term. For example, what you may perceive as a ‘loud’ sound may be ‘quiet’ to someone else, especially if that person has a hearing impairment. Remember, the physical sound intensity and sound level produced by the sound object are the same. It is why we tend to have a ‘volume’ control to enable us to adjust the ‘loudness’ of a television, phone ring, radio etc, where we can set the level to our own perceived listening sweet spot.
In a quest for objective measurements, acoustics provides us with a couple of different measurements: Sound Power Level (SWL), Sound Pressure Level (SPL), and Sound Intensity Level (SIL), which accurately measure the physical pressure of sound waves. These objective values are measured in decibels (dB). The decibel is a measurement of the difference between power or intensity in acoustic or electrical signals, expressed as a ratio.
SPL is used to measure the level of sound present at a particular point. There are a few variants of SPL measurement, but with regards loudness, dB(A) is the most relevant. The dB(A) is a weighting curve which is applied to an SPL measurement. The A-weighted curve corresponds to the sensitivity of human hearing at low levels and thus is correlated closely to perceived loudness.
To complicate matters and return to the problem of subjectivity, our ears are not uniformly sensitive to all frequencies, so a sound pressure measurement does not provide all the answers. For example, a 60Hz tone at 40dB will appear as ‘loud’ as a 15dB 1kHz tone (for more information on this, search for equal loudness contours or the Fletcher Munson Curves). So how do we get a more accurate measurement of loudness?
Given that meters don’t measure loudness, what are we seeing on our dB meters?
In most cases, a decibel meter is showing the representation of a peak value in the signal. For most analogue audio systems, it is the measure of voltage present in the circuit. For example, the voltage output from a preamp with a connected microphone. The scale shown in most digital audio workstations (DAW) shows the amplitude (size) of the signal in relation to the maximum voltage that the system can handle, before it starts to clip the signal.
Peak meters, such as PPMs, will measure the loudest amplitude points on the signal waveform, therefore they can be used as an indicator of how much headroom you have left in your system. Headroom is the ‘safety zone’ between your signal peak and the system’s maximum signal level, above which you will get clipping occurring. As such, PPM meters do not provide information about the subjective loudness of the material.

Image 1 - A dB Meter in ProTools
Meters
There are a range of meters however that have been and are used to get closer to a measurement of loudness, the most common being the VU (Voltage Unit) meter. They use the Root Mean Square (RMS) value of the signal, where the meter measures the variance of the signal over time. Even so RMS is not an accurate measure of loudness.
For example, a door slam could have a high transient peak and quick decay, but will have a low RMS measurement, compared to a constant babble of a stream which may not have any associated peaks, and could have a higher RMS value.
RMS meters are useful but we still don’t have a method for measuring ‘loudness’, and once again why should we care?
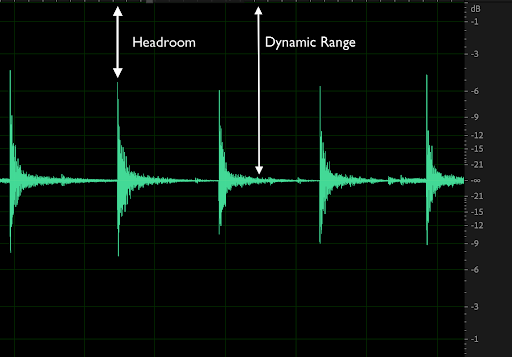
Image 2 - Signal Headroom and Dynamic Range
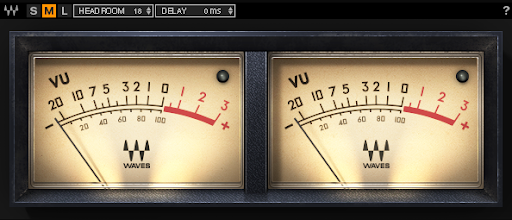
Image 3 - Digital VU Meter
So why do we need to worry about loudness?
With the introduction of digital audio and then the CD, audio and mastering engineers could push the overall level and perceived loudness of their audio thanks to processing techniques (such as brick-wall limiting) which were not possible analogue world. This led to the so-called ‘loudness wars’ of the late 1990’s and early 2000’s, where audio was squashed and compressed to appear ‘louder’ than other material. Dynamics and dynamic range were gone.
Given that most sounds are made up of a combination of transient peaks and decays or sustained /constant areas and troughs, dynamics are integral to a piece of audio. The dynamic range of a piece of equipment is the difference between the loudest and quietest sounds a piece of audio equipment can reproduce. The dynamic range of a piece of audio is the range of level changes that occur throughout a song or broadcast.
The audio waveform
By squashing the peaks and bring up the quieter parts, the audio starts to sound ‘loud’, and by trying to get the level of the audio as close to 0dBFS (the upper limit of a digital audio system) as possible, audio was becoming ‘louder’ without the consumer needing to touch their volume control.
Most people are aware of this phenomena when they complain about the way that TV commercials are usually so much ‘louder’ than the programme they were watching. Given that advertisers need attention, commercials were made to be LOUD and ideally louder than the competitors! The way engineers achieved this was by compressing and squeezing every inch of dynamic range out of the audio.
A new way to measure loudness was needed, step forward the Loudness Unit (LU).
Stay CALM
As the loudness wars rumbled on, broadcasting agencies decided to act to develop and define standards for audio programme material. This started when the European Broadcasting Union (EBU) developed a set of guidelines in 2010 (EBU R128), where the Loudness Unit (LU) was defined as a way of measuring loudness. This was followed by the introduction of the CALM (Commercial Advertisement Loudness Mitigation Act) Act in 2010, and led to a measurement unit called “LUFS” to establish loudness levels. LUFS stands for Loudness Units relative to full scale, and is now an industry standard method of measuring Loudness.
LUFS is calculated by using algorithms designed to match human perception of sounds. Returning to the Fletcher-Muson curves, which show that our ears perceive ‘loudness’ differently, in relation to different frequencies and different SPLs across the frequency spectrum. The LUFS measurement uses various frequency curves which are applied to the signal before measuring, which provide an accurate loudness measurement for humans.
The integrated loudness measurement consists of the RMS value combined with a weighting just like the A-weighting to SPL measurements. The weighting is the K-weighting, and it is used alongside Loudness Units to measure loudness in Loudness K-Weighted Full Scale (LKFS). LUFS and LKFS are the same thing; it just depends where you are in the world.
So why are LUFS your new best friend?
As audio engineers, LUFS values are now crucial as online streaming platforms are adopting loudness controls and have effectively ended the loudness war. Online streaming platforms are now adopting ‘loudness normalisation’ techniques, where the loudness (LUFS) of each song or broadcast is measured before playback. Then the file is automatically turned up or down to ensure that each programme or song plays back with the same ‘loudness’.
This is why LUFS are so important. Loudness Normalisation is the process of ensuring all tracks appear consistently loud, by matching their integrated LUFS levels - if a track exceeds this, they turn it down.
This means if you produce a heavily limited track or broadcast with a high RMS value, which jumps out the speakers, an online streaming service will turn it down the most.
But dynamic tracks, with transients and peaks and troughs are mostly left alone. The result, dynamics are back and a dynamic piece of audio will punch ‘louder’ than the limited tracks. What better way to show this than with some examples. Here are the waveforms for the same track, one is the original and the other is a heavily limited (but loud!) version.
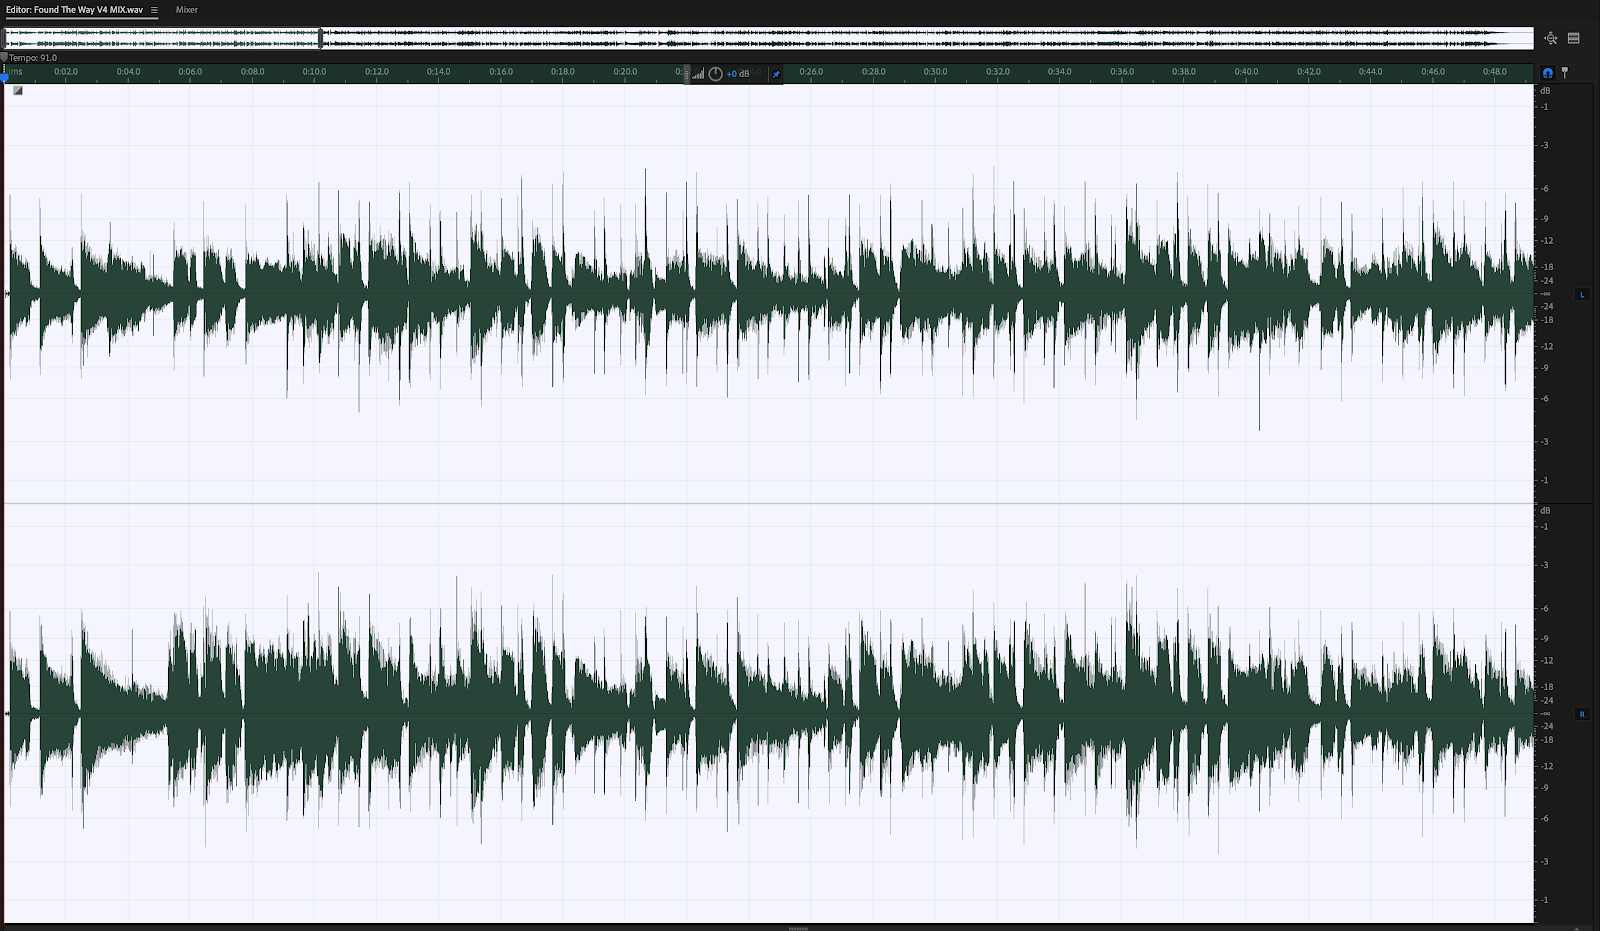 Image 4 - Original Mix -18 LUFS
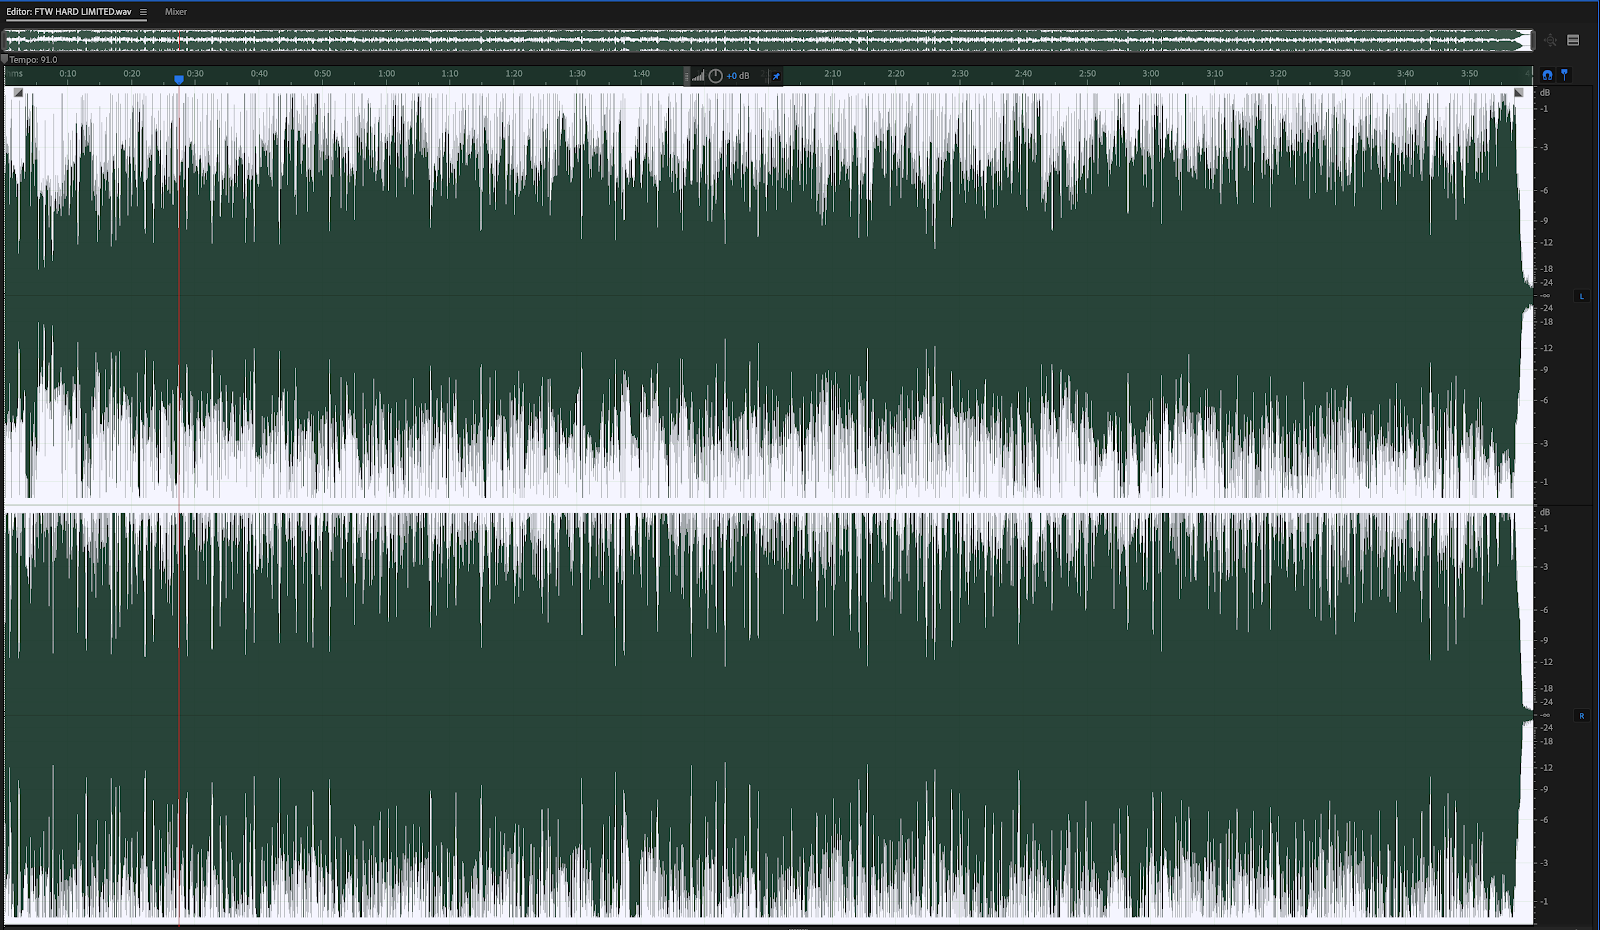 Image 5 - Heavily Limited -8 LUFS
Notice the difference, the track is now closer to 0dBFS but all of the dynamics and transients have been squashed and in some instances lost. The file is loud and would jump out at the listener compared to the original, but would sound smaller and less punchy, and also be fatiguing to the listener. The ear likes dynamic range! Let’s compare this to the original track mastered to -8 LUFS.
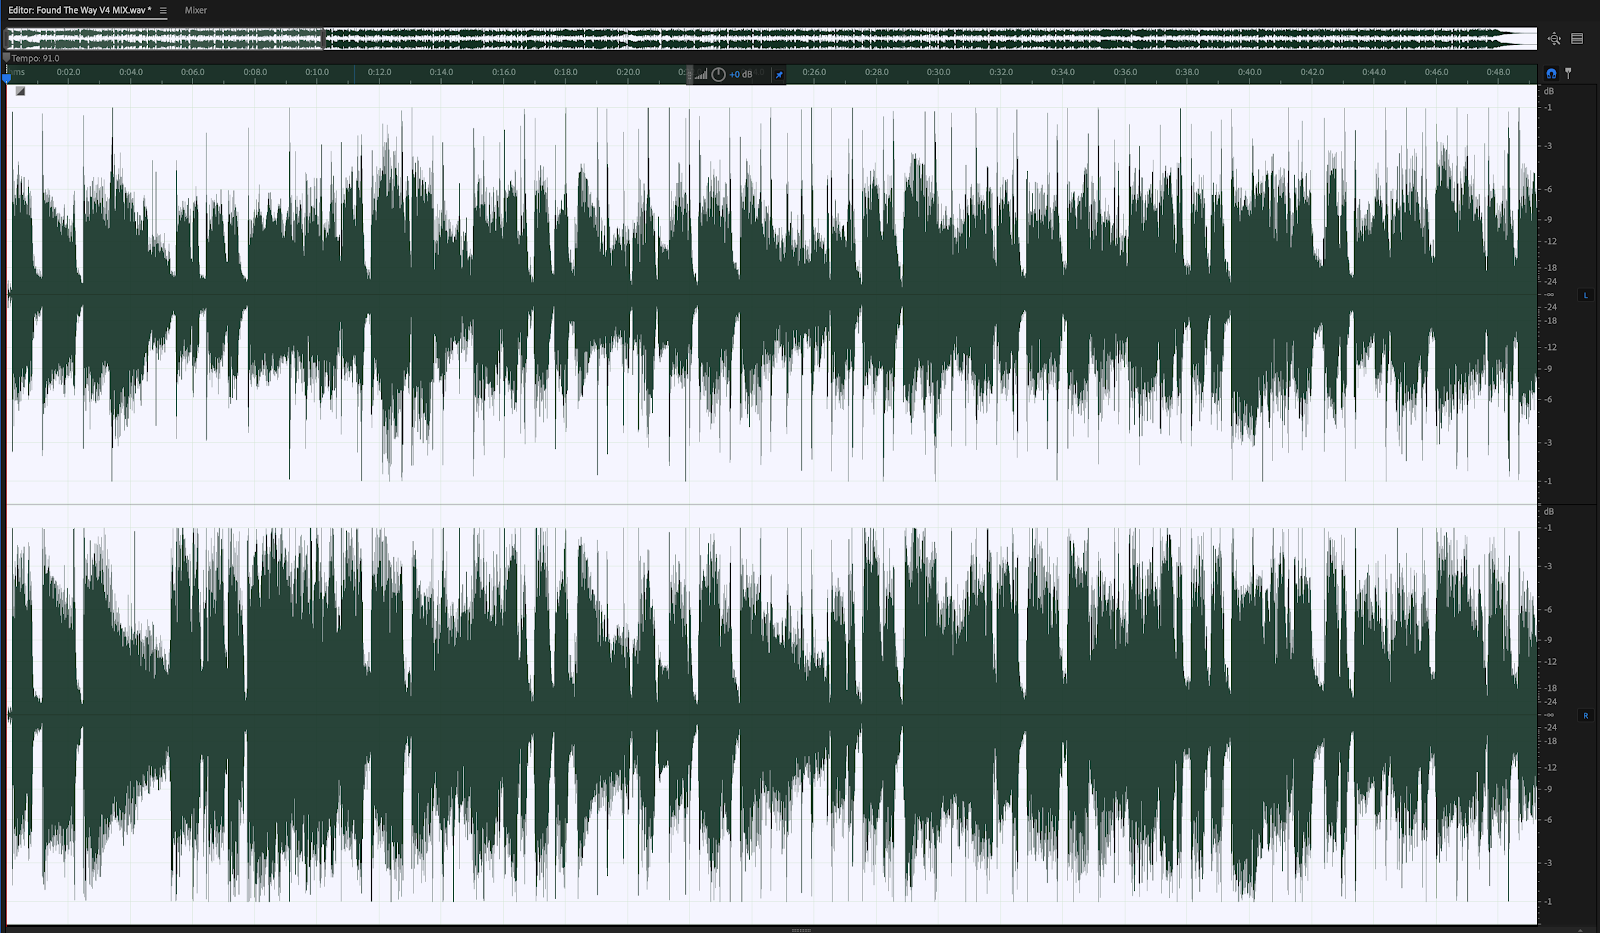 Image 6 - Original Mix -8 LUFS
The original is now perceptually louder but still maintains all of it’s dynamics and isn’t clipping. And this is where loudness really starts to matter. If both tracks are now normalised to -16 LUFS which is standard for many online streaming platforms, let’s see what happens.
Image 7 - Original Mix -16 LUFS
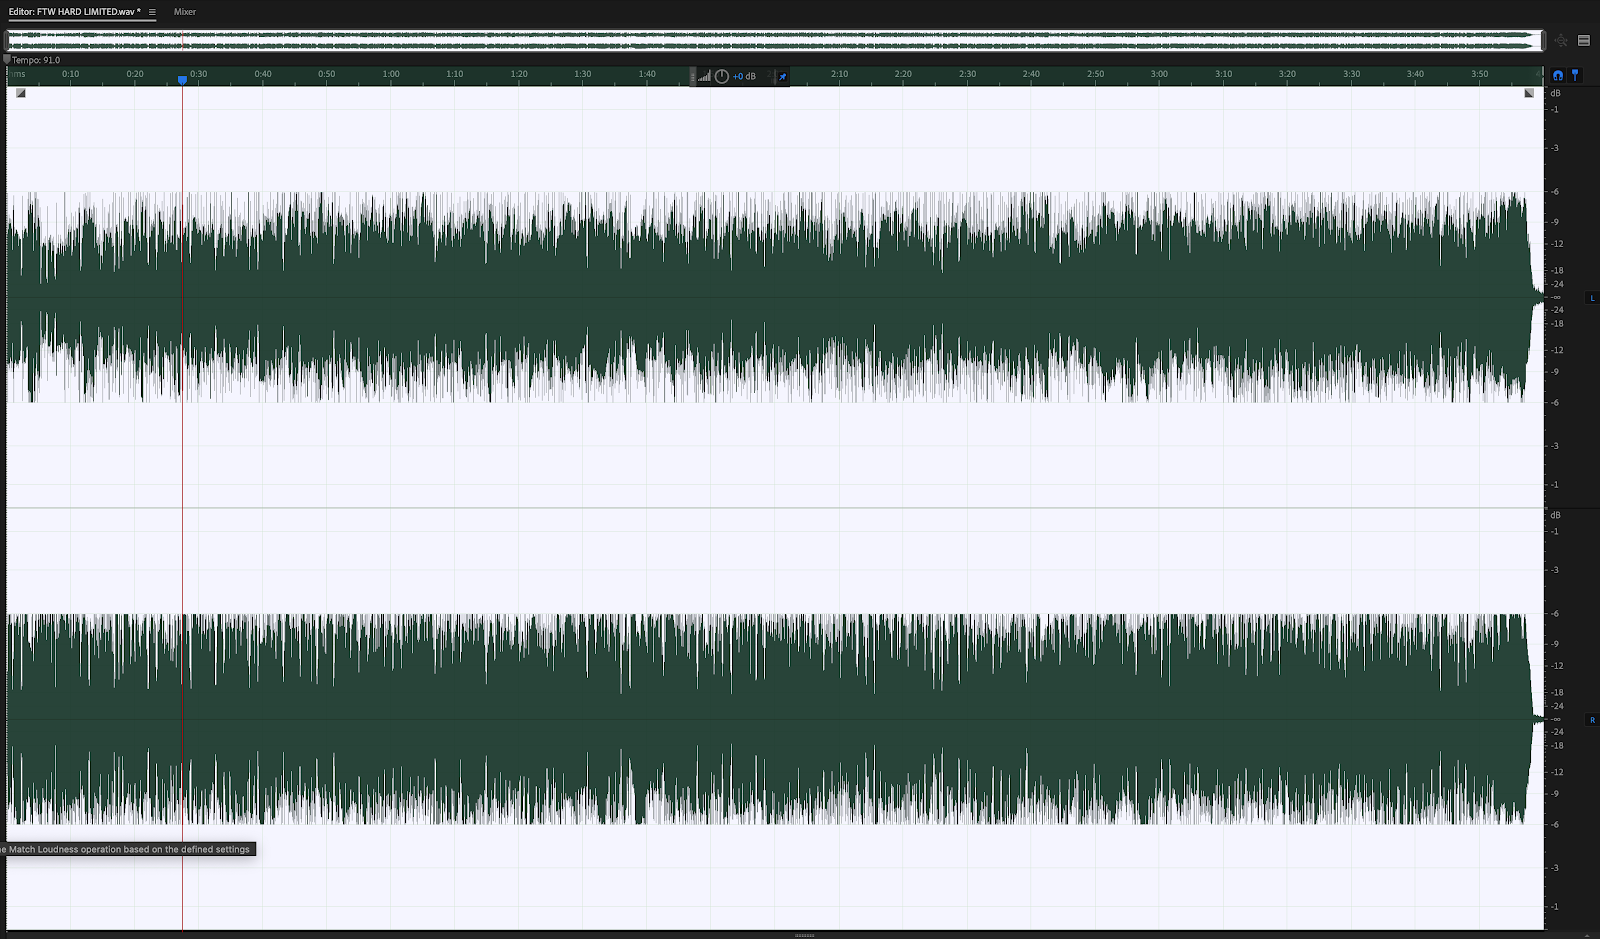 Image 8 - Heavily Limited -16 LUFS
When we look at the waveform of the limited track, we see that the block of audio hasn’t changed, it is just lower in amplitude. All that has happened is the track has been turned down by the streaming service to -16LUFS, but of course, none of the dynamics of the original are left.
The heavily limited version is still squashed and compressed with no dynamics, it is just quieter and smaller, dull and lifeless.
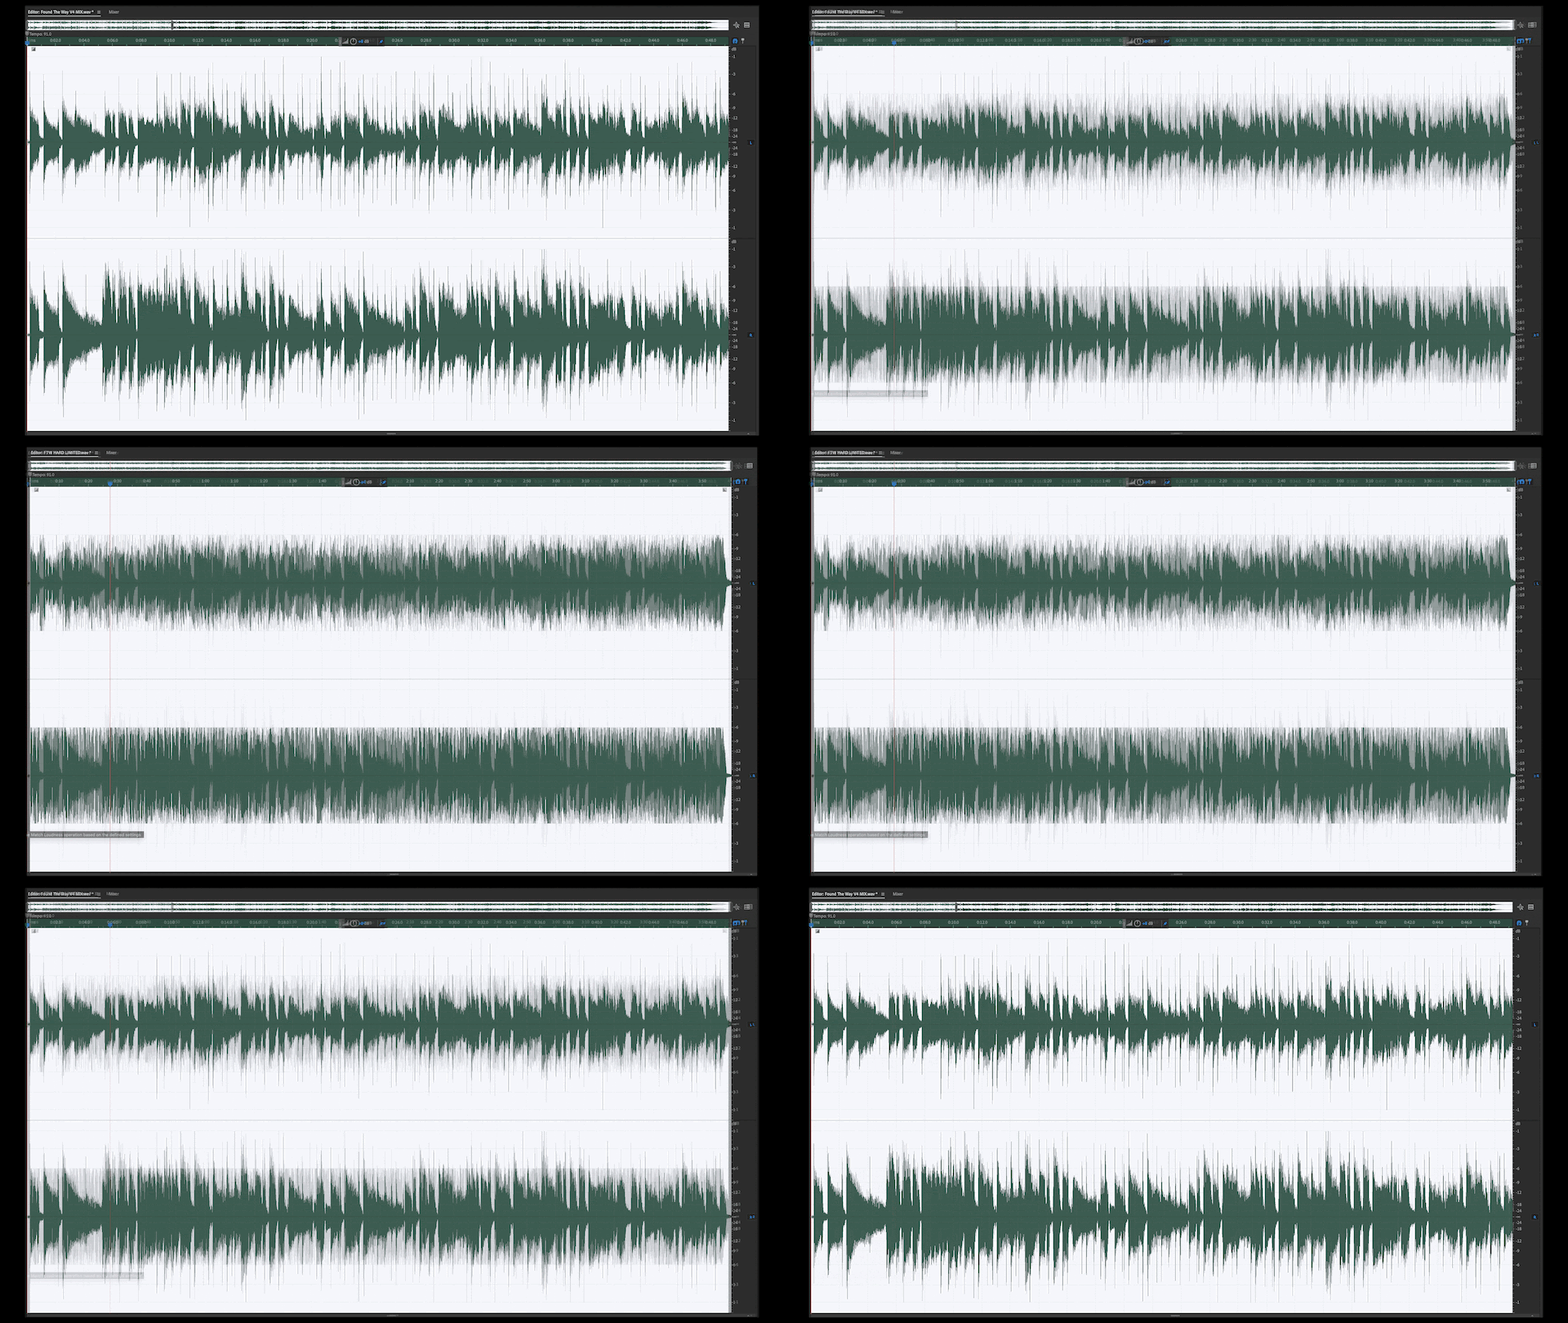 Image 9 - Both files overlayed at -16 LUFS
When we compare these side by side, the real difference between the two is evident. Remember both now have the same integrated LUFS value. One is just a block of loud audio which has been turned down, the other is a dynamic piece of audio with transient peaks which peak quite high and can give punch to the audio.
Examples of current LUFS standards
(Note Spotify, YouTube, iTunes do change these from time to time)
-24LUFS : This is the standard LUFS value for mixing for television. This is the standard which is most rigorously stuck to, because a broadcaster could get their license taken away for a breach of this standard.
-16LUFS : This is the standard LUFS for a variety of platforms. It started with Apple iTunes and was the standard for podcasts, this is still the case and the reason why it has been adopted by many other platforms, It is also common in the computer game industry.
-14 LUFS : This is the current standard for both Spotify and YouTube.
But does that mean I need to produce a different version for each platform?
No, you would be making so much unnecessary work for yourself by doing this. Whichever platform you master for, your audio will be loudness normalised to the standard of the platform. If your audio is a few LUFS out, it doesn’t really matter.
But as we have seen, what IS important is that you don’t have to crush the mixes to make them sound SUPER loud like in the days of the loudness wars. Dynamic range is better, not only will your audio sound better, listeners will get much more out of it. Remember they have the volume control, let them use it.
So, let's summarize what we covered here in this article:
- Loudness is subjective. We should probably stop using it to generally describe a piece of audio’s level.
- LU, and integrated LUFS are your friends if you are planning on releasing material on streaming services
- Dynamic range is what gives your tracks punch.
- Don’t squash the life our of your track with compression, just to make it perceptually loud.
Of course this is only part of the story, there are some other measurements that an engineer needs to consider when broadcasting or mastering audio. Step forward integrated LUFS, inter-sample and true peak measurements.

Dr Neil Bruce is a composer, sound designer and lecturer based in Manchester, UK, specialising in audio engineering and music production.
Follow Neil: Website | Youtube | Instagram


